生物素材科学特別講義
杉山淳司
京都大学 農学部/農学研究科 森林科学専攻 農学部総合館 s-248
Junji Sugiyama
Kyoto University, Faculty / Graduate School of Agriculture
sugiyama.junji.6m@kyoto-u.ac.jp
自己紹介 Profile or something that I want to say....
プラン:
イントロダクション:1限目
自己紹介.
木材の組織構造を観察してみましょう:2限目
皆さんの中には組織構造に精通した人も少なくないでしょう. しかし, 専門に勉強した人であれ, 多くの木材サンプルを見るにつれて, 同一種内のゆらぎがわかるようになり, 種間の断定的な境界を引くのを躊躇するようになります. 今回の講義では, 顕微鏡画像の機械学習を実践してみますが, その際につかう写真を撮影します.
Basics of wood identification:
In this lecture, we will practice very basic machine learning of microscopic images. We will revisit the structure of wood by taking photographs to be used for this purpose.
天然物の特性と, そこから学ぶこと:3限目
木材の形成について復習します. 葉, 枝, 材, 樹皮に至る一連の流れ. どこも捨てるところがないのが樹木の体. 樹皮は船田先生や半先生が調べておられますが, 木部と比較すると研究が多くなされていると言うわけではありません. 一方で, 紐や布などの道具や伝統的工芸としては様々利用されてきました. 今回はサクラやカバ属の樹皮について, 面白い特性と構造について紹介します.
3:Properties of natural products and what we can learn from them:
We will reinverstigate the formation of wood. From leaves, branches, trank, pith to bark. The body of a tree has nothing to discard. The bark has not been studied as much as the wood. On the other hand, it has been used for various tools such as strings and cloths for traditional crafts. I would like to introduce some interesting properties and structures of the bark of cherry and birch trees.
木材利用の歴史から学ぶこと:4限目
含水率による木材の膨潤収縮を思い出しながら, まずは「樽」と「桶」の違いを考えてみましょう. 次に, なぜ, ウイスキーにはホワイトオークが, 酒にはスギが選ばれたのか議論しましょう. 具体的な事例としては, 伝統的な屋根葺きのひとつ「こけら葺」についてお話しします.
4:What we can learn from the history of wood use:
Recalling the swelling and shrinkage of wood due to moisture content, let us first consider the difference between a "barrel" and a "tub. Next, let us discuss why white oak was chosen for whiskey and cedar for sake. As a concrete example, I will talk about one of the traditional roofing methods, "kokera-buki".
機械学習を木材科学に応用してみる!5−7限目
最近の情報知能処理に遅れまいと勉強を始めました. なんでもそうですが, 分かってくると面白いことも見つかります. 機械の判断や予測をどんなところに活かせそうか, 現在進行形の中からいくつか進捗を報告します.
5−7:Applying Machine Learning to Wood Science:
AI is becoming useful in many field. In this chapter, I will briefly explain statistical processing, supervised and unsupervised learning, using near-infrared spectra as a case study. We also build a machine learning model based on your image data. Optiionally, I will explain the generative deep learning methods that are the focus of my laboratory and introduce some examples of such methods.
昨今いろいろな分野で、AIによる予測は?という言葉がきかれます. 近赤外スペクトルを使つかった事例を取り上げ, 統計処理や, 教師あり, 教師なし学習について説明します.
木材の組織構造は, 非常に多様性に富む, 樹木の生活史の記録であり, 同時に長い進化の過程で獲得した, 樹種に固有のフォルムです. つまりその多様性には, 様々な学術的シーズとなりうる情報が畳み込まれていると予想します. これを読み解く努力が, 高い専門性と並外れた想像力を有する専門家により続けられてきましたが, 多様性と特性と定量的に連関させて理解するには至っていません. そこで, 人の「観察」を「機械学習」に置き換え, 木材の顕微鏡画像という、いわばビッグデータに潜む法則を見出し, 樹種ごとに特徴のある構造がどのように物理的・機械的な性質と関係しているか, 樹木の組織内部に記録されて環境に対する応答など, 単なる観察では不可能な解析ができないか?ということを考えています.
そのあたり,ざっくりと 理解することを目的として, 画像の機械学習の基本的な事項を説明し, 皆さんの作成したデータをもとに機械学習モデルを作ります. 最後に, 我々の研究室で注目している生成ディープラーニングの手法の説明と, その事例をいくつか紹介します.
イントロダクション Introduction
私はこれまで, 光学的な手法をメインにして, セルロースや木材について研究してきました. セルロースについては, その構造から生合成や生分解に関することや, 木材の特性に及ぼす影響などに興味を持ちました. その後, 木材の識別を始めるようになって, 組織構造に力を入れて勉強するようになりました. 木材の組織構造の多様さに困惑する一方で, 34億年の進化の理由が知りたいと思いました. 簡単にかつ素直に言えば, どうしてこんな形態が出来上がったのか知りたいと思いました. 力学的にも生理的にも最適された今の姿をどうしたら評価できるだろう, と考えるに至って, 機械学習をやってみよううと思い立ってもうすぐ10年です. 以下の文章は, HPに載せているもので, 申し訳ありませんが, 英文(間違いあり)のまま掲載します.
I have been studying cellulose and wood mainly by optical methods. For cellulose, I have been interested in its nano-level structure, its biosynthesis and biodegradation, and its influence on the properties of wood. Later, when I started to identify wood, I began to study wood with emphasis on its macroscopic structure. Now, I want to know the reasons of structural diversity as a result of 3.4 billion years of evolution. Simply and honestly, I am interested to know how such a morphology was formed. It has been almost 10 years since I decided to try machine learning, wondering how I could evaluate the present mechanically and physiologically optimized form. The following text is from my website, and I am sorry, but it is in English (with some mistakes).
電子顕微鏡によるセルロースミクロフィブリルの内部構造を可視化する
I started my master study at KU in 1984 and worked on the above titled project under the supervision of the late Professor Hiroshi Harada. Scrutinized condition for low-dose high-resolution electron microscopy was realized for the first time to visualize the molecular arrangement of cellulose chains in a microfibril. The study ruled out the existence of crystalline subunit in a microfibril and demonstrated that the size and the state of crystallinity is species specific as originally proposed by Preston in early 1950s. The technique was applied to other natural and synthetic materials and provided new aspect in the polymer studies. People says “Seeing is not always believing in high resolution microscopy, but I learned ” Seeing is powerful if there is a sound background theory. Special thanks to Dr. Yoshinori Fujiyoshi, and Prof. Natsu Uyeda at KUICR.
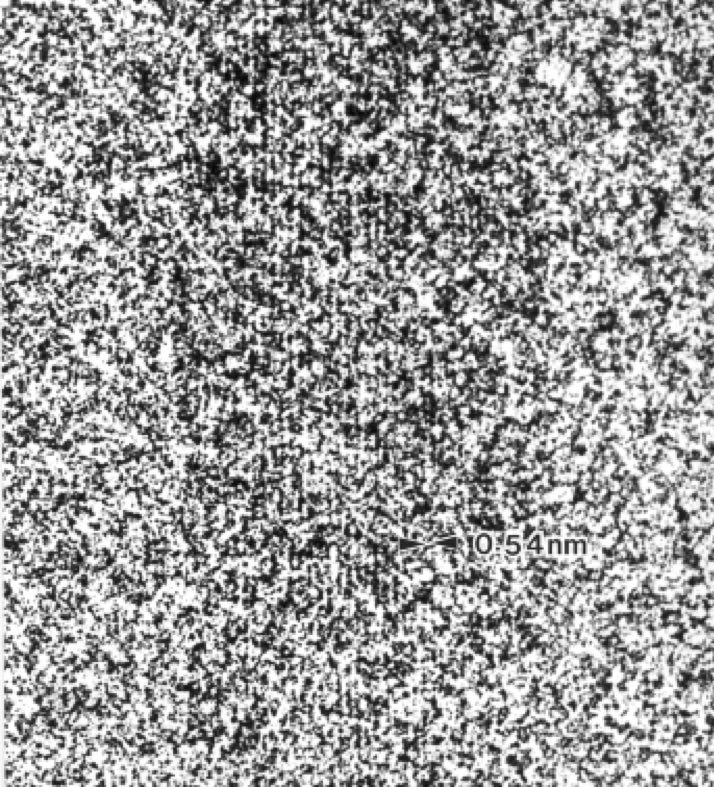
Sugiyama J, Harada H, Fujiyoshi Y, Uyeda N, High resolution observations of cellulose microfibrils,Mokuzai Gakkaishi ,30,98-99,1984
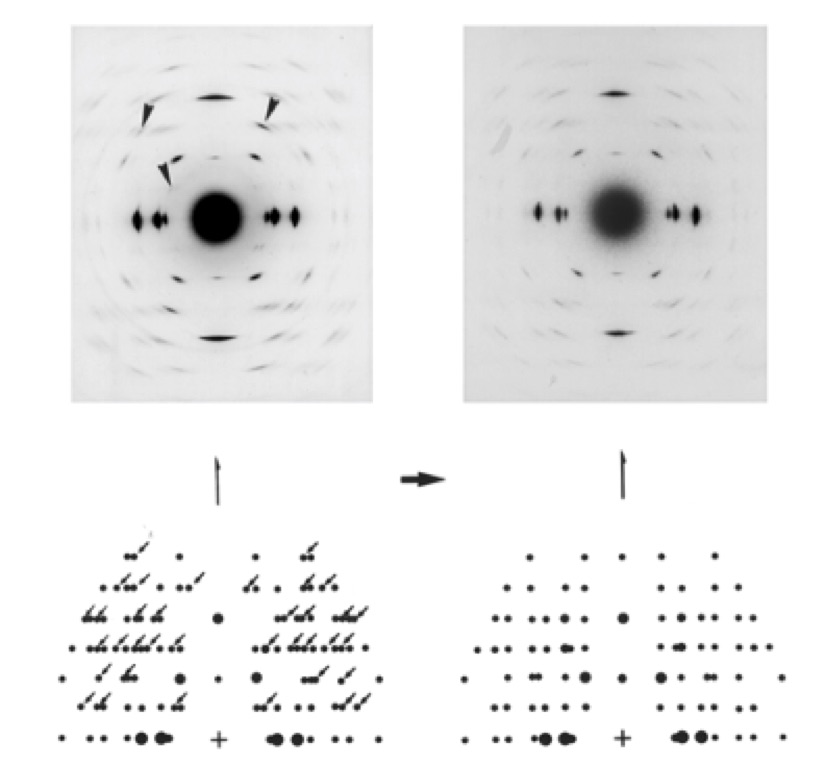
セルロースIαとIβの結晶構造
I moved from KU to UT. Under Professor Takeshi Okano’s direction, my interests start to shift from ‘seeing’ to ‘knowing’ the structure. Allomorphs of native cellulose crystal proposed by solid state NMR in 1980s has been long debated. The two-crystalline-phase concept was universally accepted when crystallographic evidence by electron micro-diffraction became available in 1991. The work was done at CERMAV-CNRS with Dr. Henri Chanzy. One-chain triclinic unit cell and two-chain monoclinic unit cell with different states of asymmetric units in crystals were determined, which lead to the proposal of the current crystal models of cellulose allomorphs. Localization of Ialpha and Ibeta in a microfibril was also proposed. Such crystallographic studies were also extended to other polymorphs such as cellulose II, IIII , beta chitin etc.
Sugiyama J, Okano T, Yamamoto H, Horii F, Transformation of Valonia cellulose crystals by an alkaline hydrothermal treatment, Macromolecules, 23, 3196-3198, 1990
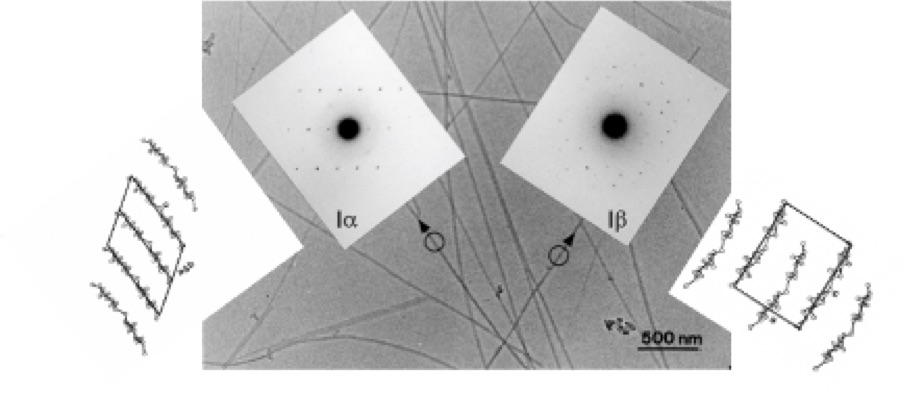
Sugiyama J, Vuong R, Chanzy H, An electron diffraction study on the two crystalline phases occurring in native cellulose from algal cell wall, Macromolecules, 24, 4168-4175, 1991
セルロース生合成における分子鎖の方位について
Back in KU but in Uji Research Campus. I start to analyse structure from the biological and biochemical point of view. This was a suggestion from one of my friend, a biochemist Dr. Bernard Henrissat. Following his advice, I investigated how the cellulose molecules are polymerized, and how the cellulases deterioate micorofibril at the molecular level.
The molecular directionality of the chains in a unit cell was first determined experimentally by electron microdiffraction analysis of labeled microcrystals in 1997. This observation confirmed the “parallel-up” model of native cellulose. Having established the parallel-up model of cellulose, the directionality of the chains in a given microfibril could be identified simply by electron diffraction analysis. When nascent cellulose microfibril generated by Acetobacter xylinum was investigated, the reducing end of the growing cellulose chains was found to point away from the bacterium. This leads to the conclusion that the polymerization by cellulose synthase takes place at the non-reducing end of the growing cellulose chains. Following this successful application of electron diffraction and cytochemical staining reaction, biogenesis of cellulose and chitin and biodegradation by cellulases and chitinases were investigated in collaboration with domestic and oversea experts.
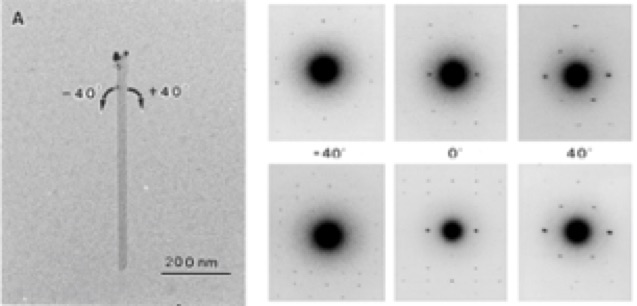
Koyama M, Helbert W, Imai T, Sugiyama J, Henrissat B, Parallel-up structure evidences the molecular directionality during biosynthesis of bacterial cellulose, Proc Natl Acad Sci USA, 94, 9091-9095, 1997
セルロース微結晶の磁場による配向とその利用
Also I was involved in material science a little bit. Emerging interest of cellulose whiskers for the reinforcement filler for bulky polymers became interested during the second visit to CERMAV at France. It was early 1990s, under supervision of Dr Chanzy and Dr Georg Maret, we demonstrated cellulose whiskers could be oriented when the non-flocculating suspension of cellulose microcrystals are placed in high static magnetic fields. Origins of this behavior, diamagnetic property, was examined by Cotton-Mouton effect and published recently (thanks to Bruno). After this experience, he was involved in several experiments on “biomimetic approach for making novel biomaterials”. I also contributed to fabricate transparent films made of nano-cellulose in its early stage of the development.
Sugiyama J, Chanzy H, Maret G, The orientation of cellulose microcrystals by magnetic fields, Macromolecules, 25, 4232-4234, 1992
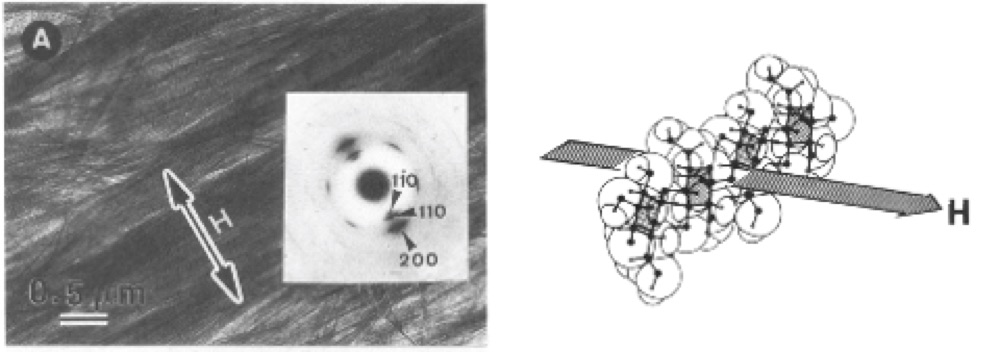
引張あて材のセルロースは引っ張られているだろうか?
I was interested in the structure and properties relationship. To keep the branch at certain angle against the gravitational force, wood forms special tissue known as reaction wood. To keep the branch at certain angle against the gravitational force, wood forms special tissue known as reaction wood. His primary interest was to measure the state of cellulose whether it is under stress or not. Upper part of hardwood branch was placed precisely in the beam and the fiber repeat distance was measured before and after the release of the growth stress. This experiment for the first time evidenced that cellulose is under tension in tension wood. Related studies were carried out to learn structure – property relationship. Along this line, the project on going is: amazing tensile properties of cherry bark, accoustic properties of Picea wood in relation to their macro- to nano-structures.
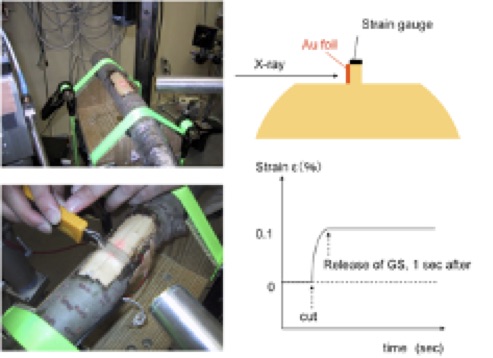
Clair B, Almeras T, Yamamoto H, Okuyama T, Sugiyama J, Mechanical state of native cellulose microfibrils in tension wood, Biophys J, 91, 1128-1135, 2006
持続的資源利用に向けたバイオマスの有効利用に関する研究
Basically, there are two subjects concerned. One is to develop a tool for rapid analysis to know the state of biomass before and after pretreatment and saccharification, for instance. The other is to visualize topochemical states of biomass during enzymatic processing to know the limiting factors that spoils the efficiency of saccharification.
Horikawa, Y., Imai, T., Takada R., Watanabe, T., Takabe, K., Kobayashi Y., Sugiyama, J., Near-Infrared Chemometric Approach to Exhaustive Analysis of Rice Straw Pretreated for Bioethanol Conversion, Applied Biochemistry and Biotechnology, 164, 194-203, 2011
Imai, M. et al. Selective fluorescence labeling: time-lapse enzyme visualization during sugarcane hydrolysis. J Wood Sci 65, 17 (2019)
京都大学生存圏研究所 材鑑調査室関係の仕事
One of good examples of his activity is wood identification. To understand what wood species were used in the cultural artifacts is important in terms of their preservation and inheritance. However, a nondestructive method is required, and wood samples must be partly cut off in conventional methods such as microscopy. Therefore, he constructed a novel system for wood identification using image recognition of X-ray computed tomography images of major species used in Japanese wooden sculptures in collaboration with Kyushu National museum.
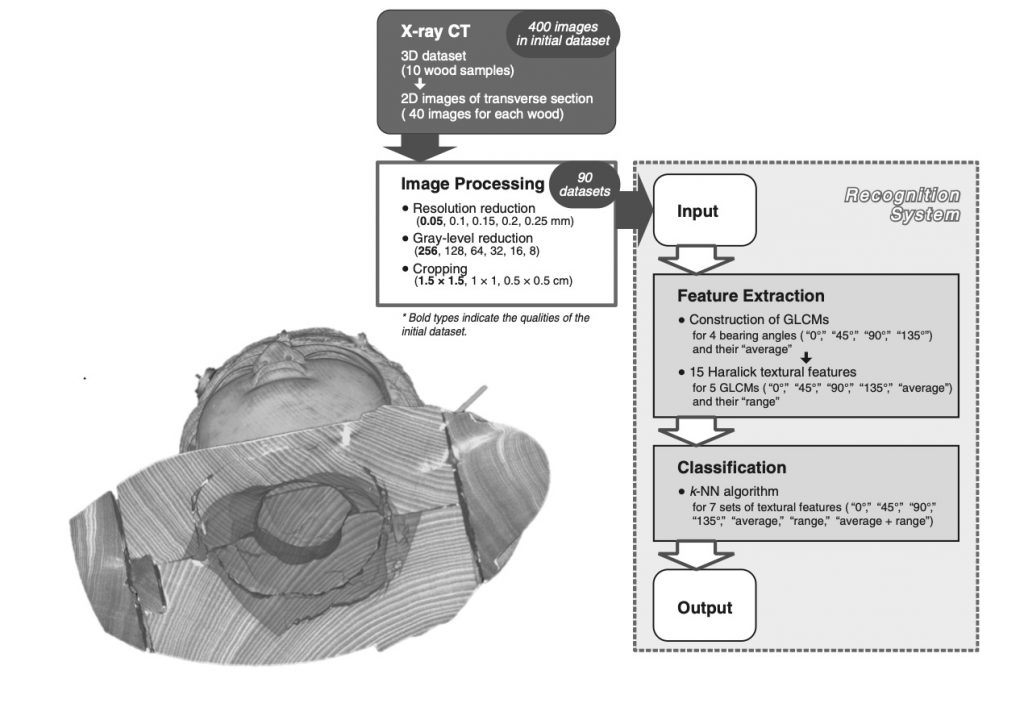
Kobayashi, Akada, Torigoe, Imazu, Sugiyama, Automated recognition of wood used in traditional Japanese sculptures by texture analysis of their low-resolution computed tomography data, Journal of Wood Science, 61(6), 630-640, 2015/09
木材の組織構造を観察してみましょう Touch real wood samples
草と木の違いを復習しましょう。
Let's review the difference between grass and trees.
A_葉の構造
https://docs.google.com/forms/d/e/1FAIpQLSfMWrXOunINMblhaBOhwtCtzsgrJIanZ5cJHqmU9v0SbRgaPA/viewform
B_形成層まで
https://docs.google.com/forms/d/e/1FAIpQLSeJY13rHodqMka1kV_pJryqjybL73VMnB9VhT6nkZBNVvIiVw/viewform
C_髄から外樹皮
https://docs.google.com/forms/d/e/1FAIpQLSfGioE6TEK5t2EfAJFhm4UH5eelRTMNV7FcKxSK1ZLaebb9jg/viewform
木材キット0~10で樹種識別の復習をします。
Let's try to identify nine typical domestic wood samples.
木材キットの番号: Tell me your wood-kit number.
針葉樹か広葉樹か: Softwood or Hardwood
https://docs.google.com/forms/d/e/1FAIpQLSd7-f1m2UgU5G5-5H-4Bs-AzrHwNTZHnVlmJbf7dZi7M9mdYw/viewform
マツ科あるなし : Are there any Pinaceae wood in your samples?
https://docs.google.com/forms/d/e/1FAIpQLSdMU_8BD9ajrgV-u9pfvWq2k7UkkFmj26Aif6zVy5fbhqVjIw/viewform
環孔材について : FInd ring-porous wood and describe the pattern of arrangement in the Lakewood
https://docs.google.com/forms/d/e/1FAIpQLSf3YM7N-3M9gN2NLceRojnc4B-jr_JV5bf-beE0MygExL6qTw/viewform
散孔材について : Find diffuse-porous wood and its specific anatomical feature
https://docs.google.com/forms/d/e/1FAIpQLSe-YDxemS87y7ff5JzdR_wB31O2CXoO1XYTq8fSRFItKZd2Dg/viewform
ブナ科はどれか : Find Fagaceae
https://docs.google.com/forms/d/e/1FAIpQLSfF_fkxN0cgQPYUxZtLbxOx9LGr94DxTWJ33sk9GoTXN3jMlA/viewform
ブナ科の特定 : Identify genus in your Fagaceae samples
https://docs.google.com/forms/d/e/1FAIpQLSddcs8Mzw0lBVjbWGpq9V9QtgjS6PJ2eb9rHp9vhXHhjjIp0Q/viewform
まとめ : Summary
https://docs.google.com/forms/d/e/1FAIpQLSeFF3Y5lA3er8kVg8oWBli5DJmB9bqru4f7U5VSTvt5Ul9Eeg/viewform
天然物から学ぶこと Learning from nature
樹木は2度生きると言われる. すなわち生物として長い間, 自らの大きな体を支え, さらに木材となってからは, 建築物や材料として我々の文化や活動を支えます. 材料学的な観点からいえば, 植物組織は, もっとも少ない素材で最適の性能をもたらすセル構造体のお手本であり, また, 単純な主成分を微妙に変化させた, 人類がまだ創造し得ない複合材料です. 本研究では, このような木本の材料としての特徴を構造学の立場から精査し, 我々人類が利用してきた理由や, 植物固有の不思議な機能を解き明かすことが狙いです.
さてサクラの樹皮は光沢があり平滑. しかし水平方向に大きく引き伸ばすことができる. ところが, 乾燥すると瞬時に破断してしまいます.
Trees are said to live twice. That is, as an organism, it supports its own large body for a long time, and then, after becoming wood, it supports our culture and activities as a building material. From a materials science point of view, plant tissue is an example of cellular structure that provides optimum performance with the least amount of material, and is a composite material that mankind has yet to create by subtly changing its simple main components. In this study, we will examine the characteristics of wood as a material from the standpoint of structural science, and aim to elucidate the reasons why we humans have been using wood and the mysterious functions inherent to plants.
The bark of cherry trees is smooth and shiny. However, it can be stretched horizontally in a wide range of directions. However, when it dries, it breaks instantly.
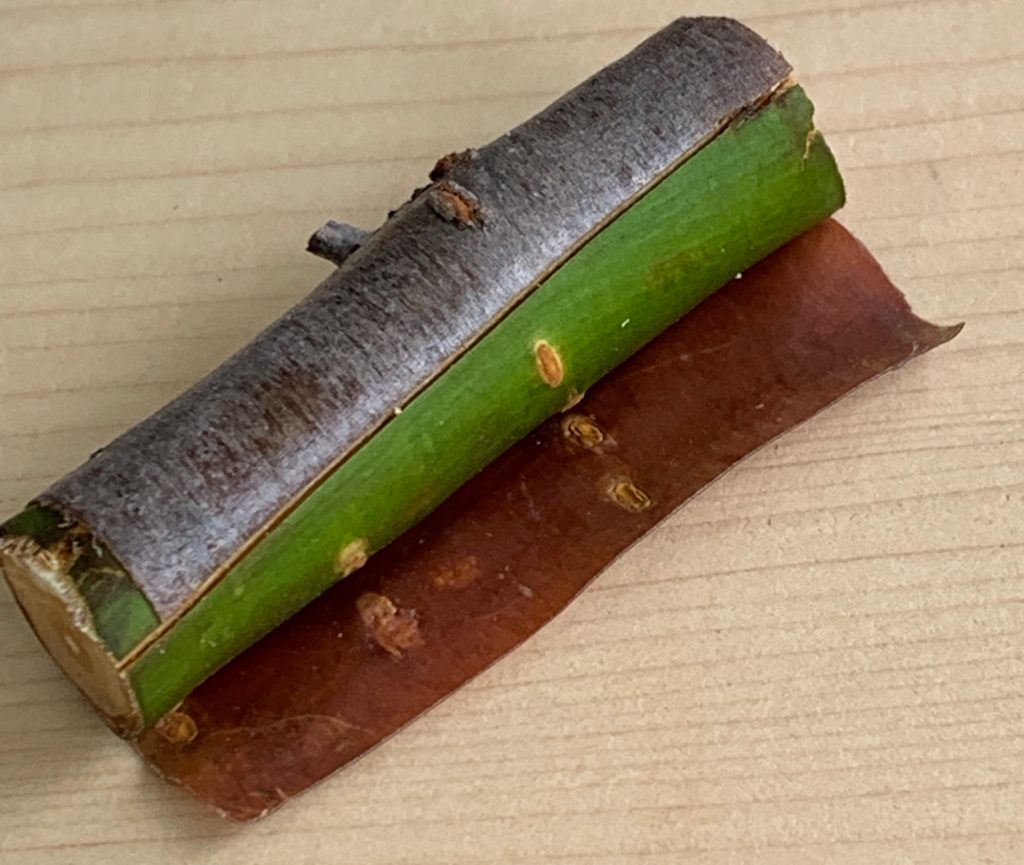
Amazing tensile property !! UP to 300% extension.
Kayoko Kobayashi, Yoko Ura, Satoshi Kimura, Junji Sugiyama. Outstanding Toughness of Cherry Bark Achieved by Helical Spring Structure of Rigid Cellulose Fiber Combined with Flexible Layers of Lipid Polymers. Advanced Materials, 30(6), 10.1002/adma.201705315
伝四郎
「樺細工」KABA ZAIKU /伝統工芸 青山スクエア
https://www.youtube.com/watch?v=qXe09V52muo
杉山淳司: 樹皮ウォッチングのすすめ, 生存圏研究, 2020
木材利用の歴史から学ぶこと Learning from wood usage
「樽」と「桶」の違いを考えてみましょう. なぜ, ウイスキーにはホワイトオークが, 酒にはスギが選ばれたのでしょうか. 教室で色々と議論しながら進める形で, 伝統的な屋根葺きについて考えてみましょう.
Recalling the swelling and shrinkage of wood due to moisture content, let us first consider the difference between a "barrel" and a "tub. Next, let us discuss why white oak was chosen for whiskey and cedar for sake. As a concrete example, I will talk about one of the traditional roofing methods, "kokera-buki".
檜皮葺 Hinoki bark
杮葺 Kokera
茅葺 Kayabuki
檜皮の収穫 Harversting Hinoki Bark
http://www.shajiyane-japan.org/img/file3.mp4
杮葺(木辺に市場の市ではありません!)とは, 伝統的な屋根の工法であり, その柿には通常, ヒノキ, サワラ, スギなどの柾目板が適しています. しかし曲率のある部分(例えば隅板)には, 追柾板が使われている. なぜでしょうか?
Shingles (not at the market market in Kibeni!) is a traditional roofing method, in which quarter-sawn boards of Japanese cypress, Japanese spruce, or Japanese cedar are usually suitable for the shingles. However, for curved parts (e.g., corner boards), osuasa shingles are used. Why is this?
Hwang, SW., Isoda, H., Nakagawa, T.,Sugiyama, J. Flexural anisotropy of rift-sawn softwood boards induced by the end-grain orientation. J Wood Sci 67, 14 (2021).
機械学習を木材科学に応用してみる!Let's apply ML to wood science.
近赤外スペクトルの解析 NIR analsis
ここでは, スペクトルデータを使って, 多変量解析について学習することを目的とします.
No matter who pens them, nor in which language they are penned, mere words fail to convey the sadness that befell us on July 17th, 2019, when Karl Norris passed away. He became a legend in his own lifetime, long before its end, a legend that will never be surpassed, and created a new world of rapid, chemical-free analysis, the World of Near-infrared Spectroscopy (NIRS). More than 50 years ago his genius recognized that what he had found in the spectra of soybeans could be metamorphosed into a technique that would revolutionize grain analysis. In the decades immediately following, his vision became reality, and the technique has since then expanded far beyond grain analysis into fields too numerous to document. https://icnirs.org/news/a-tribute-to-a-legend/
スペクトルデータ Spectroscopic dataset
「非破壊検査」, 「品質」でネット検索すると青果物の分析についての論文や装置がヒットします. 光を用いる分光法, X線などの放射線を用いる方法, または電磁気的な性質を利用する方法などあるなかで, 近赤外分光法は 1970 年代から農産物の分析に用いられています. なぜ近赤外を使うのでしょう.
私たちが水中の物体をみることができるのは可視光が水を透過するからです. それでも光が達する深さには限界があり, そこからの散乱光を見ることもできません. このことは経験的に皆知るところであり, 青が赤よりも透過率が良いために海が青く見えるのも同じ物理現象です. つまり, 可視光は水を透過するが, その程度は波長により異なること, 赤すなわち波長の長い光はより吸収されるということです. さらに長い赤外線波長を使うとどうでしょう? 赤外線吸収スペクトル法では分子内の官能基の構造を調べることができますが, 測定には水を極力排除します. それはOHやNHなどの重要な官能基の吸収付近に覆い被さる吸収を生じることと, ハード的にも光学素子を痛めやすいためです.
近赤外法はちょうど間の波長帯を利用するで, その見えない光は含水物内に浸透して, 官能基の情報も与えるという両方の性質を持つと理解できます. 具体的には, 近赤外分析で用いられる波長は果実の皮を透過して果肉のサンプリングを可能にします. 一般には, まず目的の成分が既知のサンプルからスペクトルデータを収集し, 次にスペクトルから逆に成分量を予測する校正モデルを作成します. このモデルに未知のサンプルから得た近赤外スペクトルを代入して目的成分の予測値を得ます. 操作は簡単で測定も迅速で非破壊的であることが近赤外の魅力といえます.
果実のスペクトルは残念ながら持ち合わせていないので, 木材の表面から集めたスペクトルで話を進めましょう. 4種類の熱帯産材, 市場ではメランチと呼ばれる4種のスペクトルです.
A net search for "nondestructive testing" or "quality" will bring up papers and equipment for the analysis of fruits and vegetables. Among the various methods such as spectroscopy using light, radiation such as X-rays, or electromagnetism, near-infrared spectroscopy has been used for the analysis of agricultural products since the 1970s. Why do we use near-infrared spectroscopy?
We can see objects in water because visible light can penetrate water. Even so, there is a limit to the depth at which the light can reach, and we cannot see the scattered light from there. We all know this empirically, and it is the same physical phenomenon that the ocean looks blue because blue has better transmittance than red. In other words, visible light penetrates water, but the degree of penetration depends on the wavelength, i.e., red light, i.e., light with a longer wavelength, is absorbed more. What if we use even longer infrared wavelengths? Infrared absorption spectroscopy allows us to study the structure of functional groups in molecules, but the measurement excludes water as much as possible. This is because water can cover the absorption near the absorption of important functional groups such as OH and NH, and also because water can easily damage optical elements in terms of hardware.
The near-infrared method utilizes the wavelength band just in between the two, and it can be understood that the invisible light has both properties of penetrating into the hydrous material and providing information on the functional groups as well. Specifically, the wavelengths used in near-infrared analysis can penetrate the fruit skin and allow sampling of the fruit pulp. In general, spectral data are first collected from samples with known components of interest, and then a calibration model is created to predict the amount of components inversely from the spectra. The near-infrared spectra obtained from the unknown sample are substituted into this model to obtain the predicted value of the component of interest. The attraction of NIR is that it is easy to operate, quick to measure, and non-destructive.
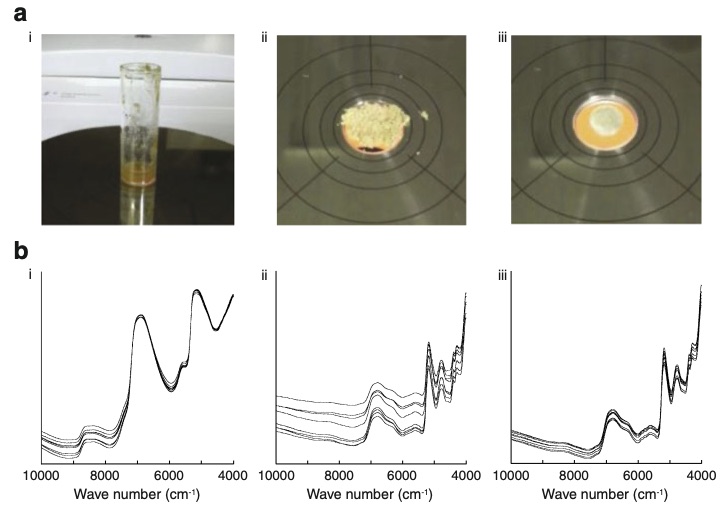
Unfortunately, we do not have fruit spectra, so we will proceed with spectra collected from the surface of wood. Here are the spectra of four tropical woods, known in the market as melanchi.
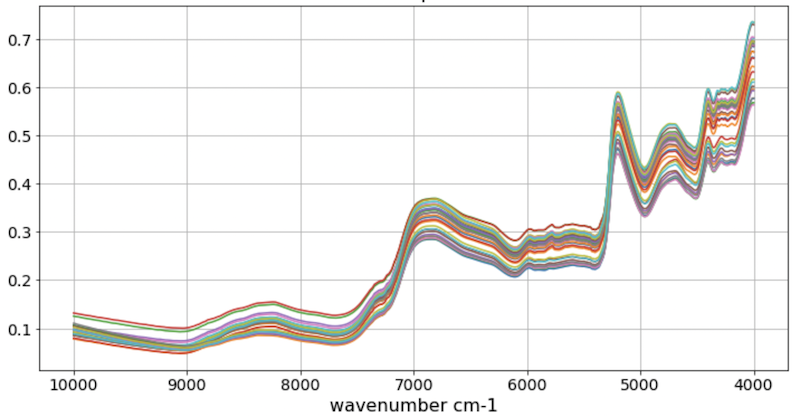
スペクトルデータは概ね緩やかな曲線で, とてもよく似ていることに注目してください. ただし, 同じ大きさの領域からサンプリングしても有機物の絶対量に応じて吸光の度合が変わるたバックグラウンドは変化します. その影響を除くため2次微分します. 下の図は波数8000cm-1から4000cm-1の領域を取り出してプロットしたものですが, 絶対値の大きさに影響されずに変化量としたため, 各サンプルを比較できるようになりました. このような処理を正規化(normalization)といいます. 正規化については後で説明します.
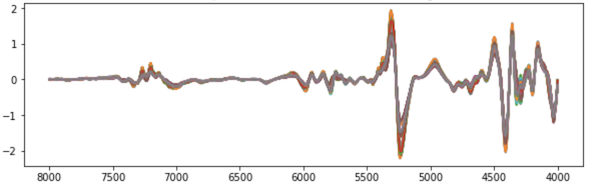
正規化後のスペクトルデータはますます似てきますが, 若干の差があるようにも見えます. 1960年代にKarl Norrisが行なった大豆の研究から始まり, このような微妙なスペクトルの変化を捉えてサンプルの特徴を取り出す多変量解析手法, 今でいうケモメトリクスという方法はあらゆる分野で発展し, 自動化された品質評価の技術として社会実装されました.
Note that the spectral data are generally very similar with gentle curves. However, even when sampling from the same size region, the background changes because the degree of absorbance depends on the absolute amount of organic matter. In order to remove this effect, we perform a second derivative. In the figure below, the region from 8000 cm to 4000 cm in wavenumber is plotted. Since the amount of change is not affected by the magnitude of the absolute value, the samples can be compared with each other. The process is called normalization.
主成分分析 Principle Component Analysis
主成分分析(Principle Component Analysis)は多次元のデータの情報のもつ傾向を低次元の情報に縮約(次元の圧縮)する代表的な方法です. 例えば, 50サンプルのデータがあり, サンプルごとに6つの測定値があるとします. 6次元のデータをグラフ上(直行する6つの軸上)にプロットしてサンプルの特徴をみることを想像できますか. しかし, これを2次元に縮約すればグラフ上に表示でき, データ全体の分布を視覚的にとらえることができるので, データがもつ情報を解釈しやすくなります.
Principle Component Analysis (PCA) is a typical method of dimensionality reduction in multidimensional data into lower dimensional information. For example, suppose we have 50 samples of data, with 6 measurements per sample. Can you imagine plotting the 6-dimensional data on a graph (on 6 orthogonal axes) to see the characteristics of the samples? However, if we reduce the data to two dimensions, we can display the data on a graph, and we can visualize the distribution of the entire data, which makes it easier to interpret the information contained in the data.
スコアープロット スペクトルデータを2次元に表現する Score plot: A way to plot spectral data in two dimension
解析の結果を、2次元に2つのグラフで示してみます. 図①は第1主成分と第2主成分, 図②は第2主成分と第3主成分の関係を示し, 図中の表示色はそれぞれメランチ属の4種を定義したものですから, 属が見事に分かれたことがわかります.
このように, 主成分分析は, 標本全体の分散を大きくするプロセスを通して, 似ているものはより近く, 似ていないものはより遠くに振り分けますので, この機能を使って, 多変量の次元圧縮に頻用されます.
スペクトルの場合は, 因子負荷量と主成分軸を併せて考えることで, サンプル間の相違点を化学構造から説明できるわけです.
The results of the analysis are shown in two graphs in two dimensions. Figure (1) shows the relationship between the first and second principal components, and Figure (2) shows the relationship between the second and third principal components. The indicated colors in the figures define the four species of the genus Merantis, respectively, so we can see that the genera are well separated.
As you can see, principal component analysis is frequently used for multivariate dimensionality compression with this feature, since it distributes the similarities closer and the dissimilarities farther through the process of increasing the variance of the whole sample.
In the case of spectra, by considering factor loadings and principal component axes together, differences between samples can be explained in terms of chemical structures.
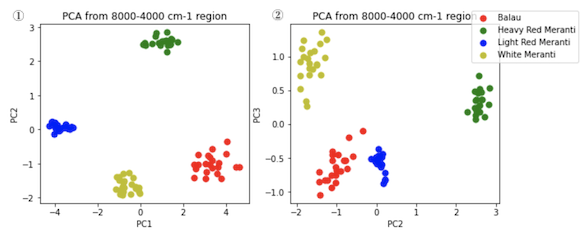
Adi D. S. et. al. (2020). Anatomical Properties and Near Infrared Spectra Characteristics of Four Shorea Species from Indonesia. HAYATI Journal of Biosciences, 27(3), 247. https://doi.org/10.4308/hjb.27.3.247
画像の機械学習 Machine learning using computer vision
スマート農業とは「生産現場の課題を先端技術で解決する!農業分野におけるSociety5.0の実現」を目指して, ロボット技術やICTを活用して超省力・高品質生産を実現する新たな農業のことです(農水省HPより). いわゆる機械学習モデルと呼ばれ る大量のデータの分析を基に, ある種の法則に基づくモデルを構築し, 農業生産に関わる予測や, 人間の判断等の支援や作業の自動化等を行うものです.
農業分野においては, 例えば病害虫被害診断とこれを踏まえた防除 支援, 施設栽培等における環境管理支援や, 農作業の自動化支援(水・肥料の投与 等), 収穫作業の自動化(ロボット等), 農業技術習得支援などの利用のための研究開 発や製品・サービスの提供が進められているところです. [農業分野におけるAI・データに関する契約ガイドライン]
しかし, 農業従事者または農業団体による農業データの提供が, ノウハウや技術の流出とならないよう, 農業関係者が安心 して農業データを提供できる枠組みを提供する必要があるとの考えから農林水産省では「農業分野におけるAI・データに関する契約ガイドライン」を策定しています.
いちごの成熟度を認識して自動で収穫するロボットなど, 大規模データの機械学習に基づく実用化された技術も多いようです. ここではそのような技術の基本となる要素技術, すなわち画像を用いた機械学習について解説します.
Smart Agriculture refers to "solving problems on the production farms Aiming to "realize Society5.0 in the agricultural sector," it refers to a new type of agriculture that utilizes robotic technology and ICT to realize super-efficient and high-quality production (from MAFF website). The model is based on the analysis of a large amount of data, so called machine learning models, and is designed to predict agricultural production, assist human decision making, and automate tasks.
In the agricultural field, for example, research and development and provision of products and services are underway to support diagnosis of pest damage and pest control, environmental management in house cultivation, automation of agricultural work (water and fertilizer administration, etc.), automation of harvesting work (robots, etc.), and support for learning agricultural technology. [Contract Guidelines for AI and Data in the Agricultural Sector].
However, the Ministry of Agriculture, Forestry and Fisheries (MAFF) has established the "Contract Guidelines for AI and Data in the Agricultural Sector" to provide a framework for farmers to provide agricultural data, so that the provision of agricultural data by farmers or agricultural organizations does not result in the outflow of know-how and technology. .
There are many practical technologies based on machine learning of large-scale data, such as a robot that recognizes the maturity level of strawberries and harvests them automatically. This section describes the basic elemental technologies of such technologies, namely, machine learning using images.
AIというってもピント来ない人は7年前ですがTEDのLi教授の講演を見てください. LI FAI FAI
また、実装例としては以下の企業のサイトが参考になるように思います。
The following company's website seems to be helpful as an example of such implementation.
画像ファイルの構造
デジタル画像は, 2次元の画素の集合体です. 画素はピクセルやドットと呼ばれますが, デジタル画像の最小単位で, 位置と強度の情報を持ちます. 青森県の「まるごと青森」というHPから写真をお借りしました.
A digital image is a collection of two-dimensional pixels. A pixel, called a pixel or a dot, is the smallest unit of a digital image and has information on position and intensity. I borrowed this photo from the website "Marugoto Aomori" of Aomori prefecture.
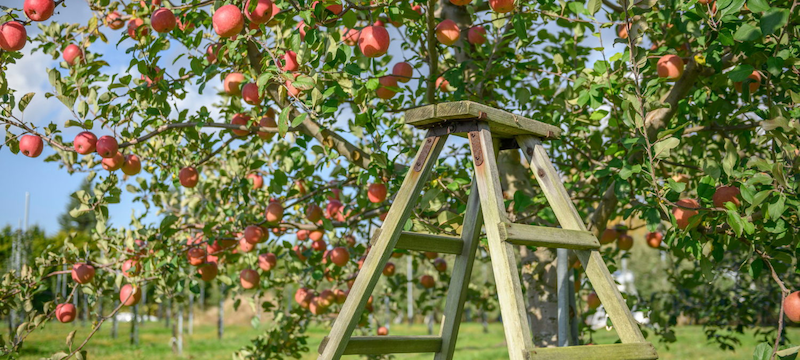
階調をRGBに変換し, その画像の左上から180x180ピクセルの画像を切り出して, 元画像に続けてチャンネル(RGBごと)に表示し, 最後にRGB画像をグレースケール変換した画像を表示します. これからも, 画像データは, 2次元の数値データ配列が層状に重なったものであることが理解できるでしょう.
The grayscale image is converted to RGB, an image of 180x180 pixels is cut out from the upper left corner of the image, the original image is followed by the channels (by RGB), and finally the grayscale converted RGB image is displayed. It can be understood that the image data is a layered array of two-dimensional numerical data.
実際に左上から10x10ピクセルのチャンネル0即ち赤の数値データは以下の通りで, 0~255までの整数, 即ち8bitであることがわかりました.
In fact, the numerical data of channel 0, i.e., red, in the 10x10 pixels from the upper left corner is as follows, and is an integer from 0 to 255, i.e., 8 bits.
array([[132, 132, 132, 132, 133, 133, 134, 134, 134, 135], [132, 132, 132, 132, 133, 134, 134, 135, 135, 136], [132, 132, 133, 133, 134, 135, 135, 136, 136, 137], [131, 131, 133, 134, 135, 136, 136, 136, 138, 138], [137, 138, 136, 135, 135, 133, 134, 137, 136, 137], [101, 124, 132, 135, 135, 140, 140, 138, 139, 140], [ 46, 96, 97, 77, 92, 111, 132, 145, 145, 137], [ 62, 90, 96, 63, 69, 68, 82, 113, 134, 145], [134, 84, 41, 71, 72, 77, 76, 73, 109, 165], [139, 138, 108, 58, 68, 105, 79, 136, 186, 198]], dtype=uint8)このような画像データを用いて, ロボットがリンゴが熟したかどうかを自動的に判断し, 収穫を行うようにするのがいわゆるスマート農業です.
Using such image data, robots can automatically determine whether apples are ripe or not and harvest them.
学習が必要な理由
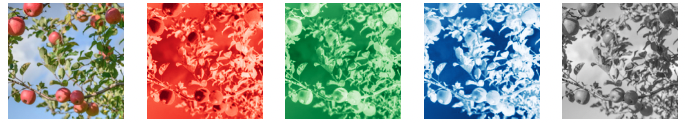
まず, 上の写真からリンゴを抜き出すのにはどうしたらいいでしょうか?それぞれの標本が持つ固有の特徴を求める必要があります. リンゴは赤いから赤のチャンネルの値を使って閾値を決めることができるでしょうか. 回次の図は階調の値が200より大きなピクセルをリンゴとしてみましたが, リンゴを選択的に抜き出すことはできていません. つまり, 日当たりの良いものもあれば, 葉や枝の影になっているもの, さらにはリンゴのうしろに隠れているリンゴとか, 一つの基準では到底線引きのできないリンゴが写っているわけです. ではなぜ我々が認識できるのかといえば, 丸い形であるとかも含め, 複数の基準で持って判断をしていることに他なりません. そのような情報を計算機に学習させることができれば賢いAIができることになります.
First of all, how can we extract an apple from the above picture? We need to find the unique characteristics of each sample. Since apples are red, can we use the value of the red channel to determine the threshold value? In the following figure, pixels with gray scale value greater than 200 are considered as apples, but we are not able to selectively pick out apples. In other words, some of the apples are in good sunlight, some are in the shadow of leaves or branches, and some are hidden behind the apples, which cannot be distinguished by any single criterion. The reason why we human can recognize them is that we have multiple criteria to judge them, including the roundness of the shape. If we can make the computer learn such information, we will have a smart AI.
コンボリューショナルニューラルネットワーク Convolutional Neural Networks
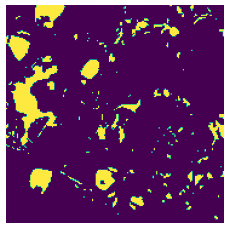
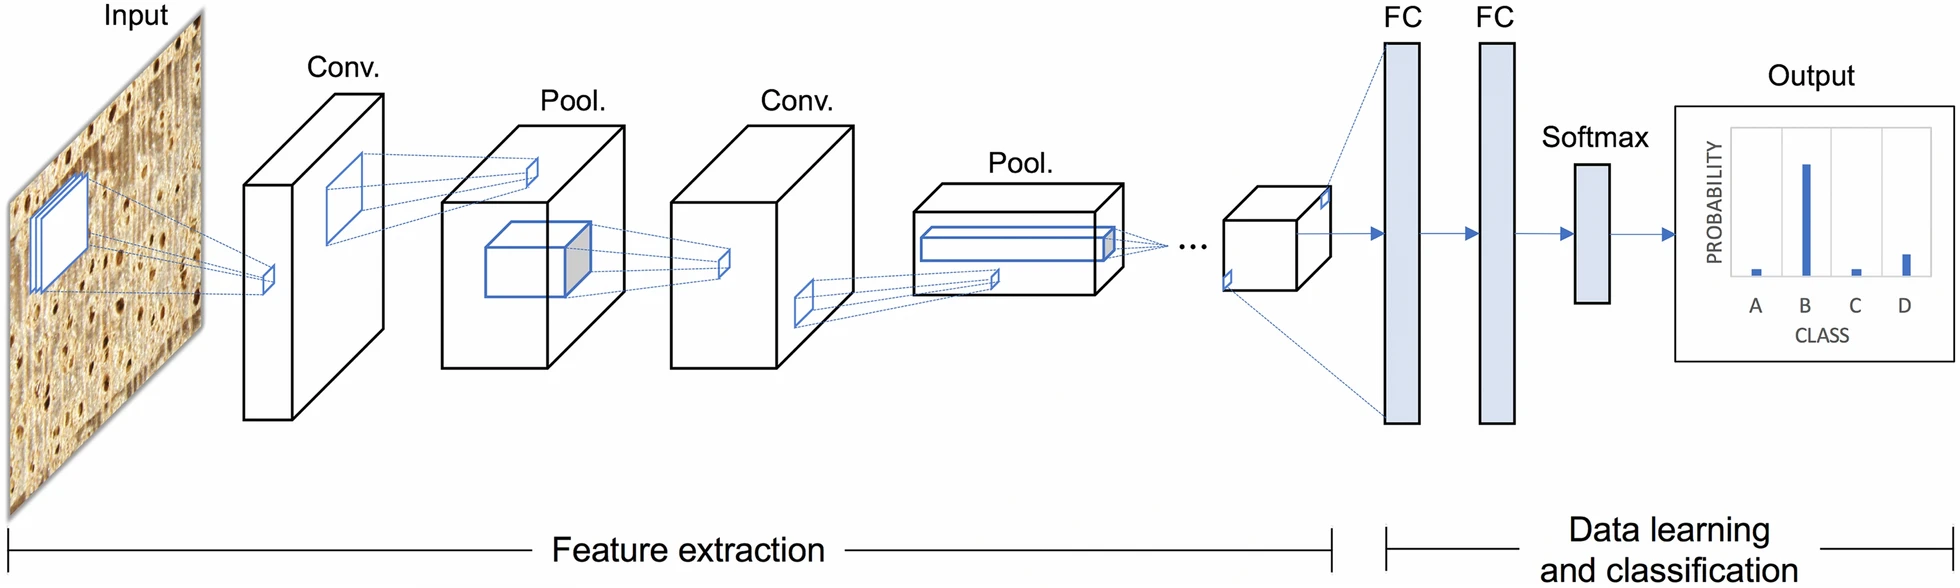
画像の2次元的な情報を学習するアルゴリズムの基本形が, いわゆる畳み込みニューラルネットワーク(CNN:Convolutional Neural Network)です. 畳み込み計算とは, ある関数$A$を平行移動しながら関数$B$に掛ける, 足す処理である. 局所的な濃度変化, エッジなどを検出するフィルター演算処理(積和)である.
The basic form of an algorithm for learning two-dimensional information of an image is the so-called Convolutional Neural Network (CNN). Convolutional computation is the process of multiplying or adding a function $A$ to a function $B$ while translating. It is a filtering operation (sum-of-products) to detect local density changes, edges, and so on.
CS231n Convolutional Neural Networks for Visual Recognition Course Website https://cs231n.github.io/convolutional-networks/
Convolution Demo. Below is a running demo of a CONV layer. Since 3D volumes are hard to visualize, all the volumes (the input volume (in blue), the weight volumes (in red), the output volume (in green)) are visualized with each depth slice stacked in rows. The input volume is of size W1=5,H1=5,D1=3W1=5,H1=5,D1=3, and the CONV layer parameters are K=2,F=3,S=2,P=1K=2,F=3,S=2,P=1. That is, we have two filters of size 3×33×3, and they are applied with a stride of 2. Therefore, the output volume size has spatial size (5 - 3 + 2)/2 + 1 = 3. Moreover, notice that a padding of P=1P=1 is applied to the input volume, making the outer border of the input volume zero. The visualization below iterates over the output activations (green), and shows that each element is computed by elementwise multiplying the highlighted input (blue) with the filter (red), summing it up, and then offsetting the result by the bias.
このような計算を繰り返して, 何枚ものフィルター処理をしてデータの局所領域の特徴を抽出つつ, ストライドで画像を縮小することを繰り返して最終的に, 2次元の画像の情報を一次元のベクトルに落とし込んで, 判別問題あるいは回帰問題のモデル(最小二乗法によってフィルタの係数を解く)を求めます.
The calculation is repeated to extract features of local regions of the data by filtering a number of images, while repeatedly reducing the image by stride. Finally, the information in the two-dimensional image is reduced to a one-dimensional vector to obtain a model for a discrimination problem or a regression problem.
フィルタリングの実際 Filtering (convolution)
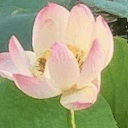
浄土宗の本山で東山の華頂山にある知恩院というお寺で蓮の花を写真に撮りました. 畳み込み演算をまずみてみましょう. フィルターによる畳み込み計算を最初の3つのフィルターは垂直方向, 水平方向, 対角線方向に濃度差を持たせたもので, その方向に垂直なエッジ(濃度の変化があるところ)が強調されているのがわかります. 4番目と5番目のフィルターは逆に輪郭を隈取りするような効果があるかに見えます.
I took this photo of lotus flowers at Chion-in Temple, the head temple of the Jodo sect, at Kacho san. Let us look at the convolution operations first. The first three filters have density differences in the vertical, horizontal, and diagonal directions, and you can see that the edges perpendicular to these directions (where there is a density change) are emphasized. The fourth and fifth filters seem to have the opposite effect, i.e., they seem to shade the edges.
識別ネットワークの試作 Making first model of identificaton
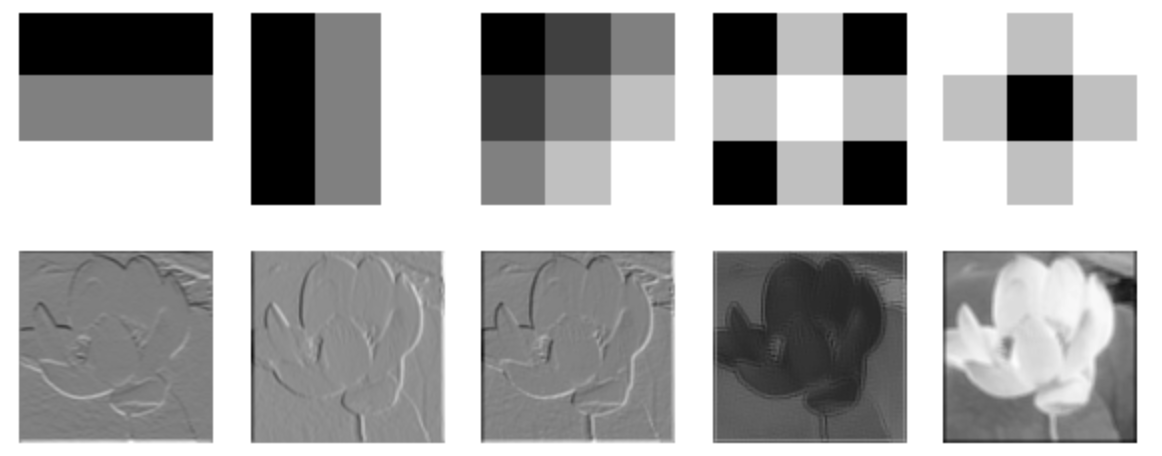
数年前, 農工大の学生さん達と京都御所に植栽されている樹木の樹皮の画像データベースを作りました. 各自撮影した写真を樹種ごとにフォルダにまとめ, 各画像の中心部分から$128 \times 128$ pixelの画像を切りとったのが下の図です. 全体の85%のデータを学習用に, 残りの15%を評価用としてtrainとtestデータベースを準備します.
A few years ago, I made an image database of bark of trees planted in Kyoto Imperial Palace with students of Tokyo University of Agriculture and Technology. We put the photos taken by each of us into a folder for each tree species, and cropped out $128 \times 128$ pixel from the center of each image. The train and test databases are prepared with 85% of the total data for training and the remaining 15% for evaluation.
単純な4層からなる直列のモデルを作成して, 計算した学習曲線が次の図です.
The following figure shows the learning curve calculated by creating a simple 4-layer series model.
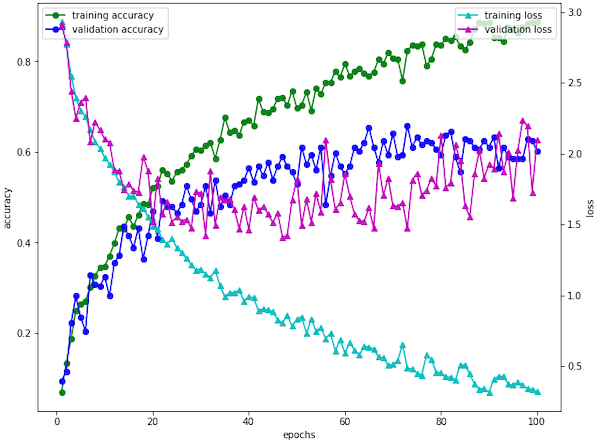
学習用データから作成するモデルの精度はどんどん上昇していますが, 評価用のデータを使った精度の向上は頭打ちとなり, 50試行回を超えるとロスも小さくならなりました. この原因は, モデルが学習用のデータに合いすぎた, つまり勉強のしすぎです. このような現象を「過学習」といい, 機械学習では注意するべきことの一つですが, 学習用データを増やすこと以外にも, ネットワークに工夫するなど様々な対策がとられるところです. ここでは触れずに置きます. さて, 次にこの不完全なモデルで, 実際のテスト画像をいくつか予測してみましょう.
Although the accuracy of the model created from the training data has been increasing, the improvement of accuracy using the data for evaluation has reached a plateau, and the loss has even increased after 50 trials. The reason for this is that the model fits the training data too well, i.e., 'too much studied' . This phenomenon is called "overlearning," and is one of the things to pay attention to in machine learning. I will not mention them here. Now, let us try to predict some real test images with this imperfect model.
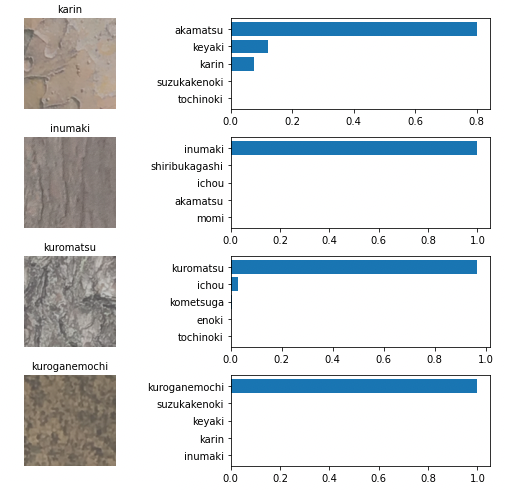
以上, 4層のCNNによる街路樹樹皮の自動認識の試みでした.
This is an attempt of automatic recognition of roadside tree bark using a 4-layer CNN.
CNNのメリット Merit of CNN
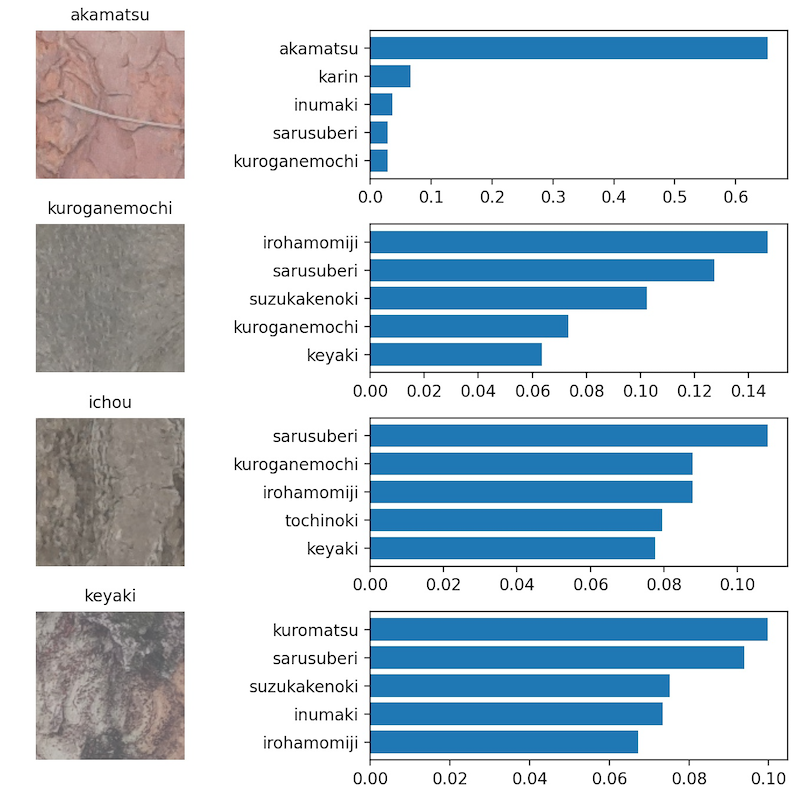
ここで扱った画像は$128\times128\times3$(pixel, pixel, channel)の2次元のデータです. そこにCNNという新しい概念を応用して, ニューラルネットに組み込みました. もし、画像を一次元にして判別させたらどうなるか試してみます. 画像は49152個の1次元データとして扱います. 計算したモデルの精度は11%でした.
アカマツのように特に赤っぽいものは正確に識別されましたが, そのほかは全く予想が効かないようです. その理由について考えることで, CNNがどのような特徴を識別判断に使うのか理解が進むかもしれません.
The image we deal with here is two-dimensional data of $128\times128\times3$ (pixel, pixel, channel). We applied the concept of CNN to it and incorporated it into a neural network. Let's try to see what happens if we make the image one-dimensional and discriminate it. The images are treated as 49152 one-dimensional data. The calculated accuracy of the model is 11%.
The reddish ones, such as red pine, are correctly discriminated, but the others do not seem to be predictable at all. By considering why this is the case, you may gain a better understanding of what features CNNs use to make discriminative judgments.
進化するネットワーク Networks that develops
深層学習の分野における進歩には目を見張るものがあり, 数学的な基礎から応用技術に至るまで広範です. 今後農学分野でどのような利用があるか, また環境データサイエンスという枠組みの中でとのような進展があるか, 予想もつきません. 私が機械学習に興味を持った時点では, 人のできない判断や予想ができるということで, 専門性を必要としない樹種の同定や, 木材を使う上での物性の予測ができれば良い程度に思っていました. 今や, 人ができないことをずっと上手くやるということがあながち無理ではないと感じています. そういう感覚を持った原因となった展開の一つが, 生成ディープラーニング(generative deep learning)です.
簡単にいうと, 画像を学習し, 自ら画像を作り出すネットワーク, 音楽を学び, 自ら作曲するネットワークです. このような技術をどのように研究に活かせていくか, 過度に依存するのも問題のようには思いますが, 確実に重要な技術になるように感じます.
The progress in the field of deep learning has been spectacular, ranging from mathematical fundamentals to applied techniques. It is difficult to predict how deep learning will be used in the future in the field of agriculture, or how it will develop in the framework of environmental data science. When I first became interested in machine learning, I thought that it could make decisions and predictions that humans could not make, and that it would be good if it could identify tree species and predict the physical properties of wood for use without requiring expertise. Now, I feel that it is not unrealistic to make computer to do what human cannot do, and to do it betterl all the time. One of the developments that led to this feeling is generative deep learning.
Simply to say, it is a network that learns images and then creates its own images, and a network that learns music and composes its own music. How to apply such a technology to research seems to be a problem, although I think that over-reliance on it is also a problem, but I feel that it will certainly become an important technology.
Specifically, the following knowledge and techniques are also useful for microsopy:
UNET: フライブルグ大学
https://lmb.informatik.uni-freiburg.de/people/ronneber/u-net/
画像からスタイル(様式)を取り出す敵対的生成ネットワーク*
道管の自動抽出と経年変化パターンの解析
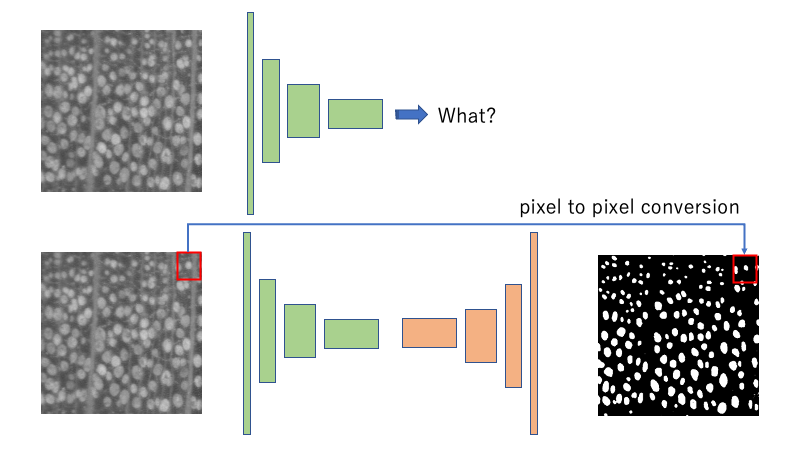
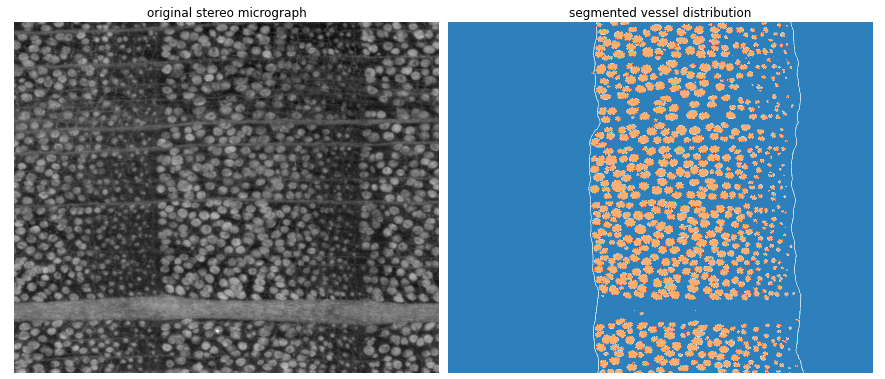
木材の細胞を一つ一つ認識して, 細胞種ごとに名前をつけて, 計測してということが可能になりました. また, 低倍率の実体顕微鏡画像から道管を自動的に認識して, 一つの年輪から取り出すような作業も自動化できるようになりました.
It is now possible to recognize individual wood cells, each cell type, and do measurements. It is also now possible to automate tasks such as automatically recognizing all vessels in low-resolution stereomicroscope images and extracting them thought a single annual ring to analyse.
舩木, 陳, 粟野, 吉永, 杉山ら:木材学会発表 (2022)
コンピュータービジョンによる細胞毎変形解析 Cell-by-cell deformation analysis by computer vision
同様の方法を発展させてビデオ画像に応用しました. 細胞抽出をビデオ画像一枚一枚に適用して, 抜き出した個々の細胞をトラッキング(追跡)します. この技術で, 変形下にあるどの細胞がどの程度ひずんだか解析できるようになりました.
We have developed a similar method and applied it to video images. Cell extraction is applied to each video image and each extracted cell is tracked. With this technique, it is now possible to analyze which cells are distorted and by how much under deformation.


Chen, Shuoye, Awano, Tatsuya, Yoshinaga, Arata and Sugiyama, Junji. "Flexural behavior of wood in the transverse direction investigated using novel computer vision and machine learning approach" Holzforschung, vol. 76, no. 10, 2022, pp. 875-885. https://doi.org/10.1515/hf-2022-0096
ラジアルファイルの自動認識とMFA測定 Automatic radial file recognition and MFA measurement
顕微鏡画像から細胞を一つ一つ抽出し、それらの位置関係を調べ、グラフ理論をつかって放射方向の列を認識して自動抽出する方法を構築しました。同時に、偏光顕微鏡を利用してMFAを測定する方法を開発し、両者をあわせて利用することでラジアルファイル内の細胞の形態とMFAの変化を追跡するシステムを立ち上げました。
We constructed a method to extract cells one by one from microscope images, examine their positional relationships, and automatically extract them by recognizing radial columns using graph theory. At the same time, we developed a method to measure MFA using polarized light microscopy, and by using both methods together, we launched a system to track changes in cell morphology and MFA in radial files.

Kita Y, Awano T, Yoshinaga A, Sugiyama J (2022) Intra-annual fluctuation in morphology and microfibril angle of tracheids revealed by novel microscopy-based imaging. PLoS ONE 17(11): e0277616. https://doi.org/10.1371/journal.pone.0277616
隣接グラフを利用した細胞ー細胞間の距離の測定 : Cell-Cell distance map using RAG

ラジアルファイルの追跡 : Tracking radial file to trace the cambial activity
![]()
さらに興味のある人へ For further interest
木材画像の機械学習に関するレビューを出しました.
I have published a review on machine learning of wood images.
Hwang, SW., Sugiyama, J. Computer vision-based wood identification and its expansion and contribution potentials in wood science: A review. Plant Methods 17, 47 (2021). https://doi.org/10.1186/s13007-021-00746-1
文化財木製品の識別作業の協力
文化財に代表される貴重な木製品や構造物を末長く維持することためには科学的調査が不可欠です. しかし, 文化財として指定されたものは, 非破壊・非侵襲の測定が原則です. そのため, 国立博物館にはX線CTが導入されて仏像などの内部調査に威力を発揮しています. 得られる木材の画像は低分解能ですが, その情報を頼りに, 木材に関する知識や機械学習技術を駆使することで, 樹種の同定や, 木取りや制作手順などに関する様々な情報を引き出すことができます. 文化財の健康診断の際に, われわれの分野で社会貢献できることの一つかもしれません.
興福寺 監修 阿修羅像のひみつ 興福寺中金堂落慶記念 2018年8月10日
ISBN:9784022630759